Maxim Massenkoff
Stata commands for self-documenting tables and figures
Have you ever struggled to find the exact script that made a certain table or figure in Stata?
Here are two Stata commands that make it easier to document output. The syntax is just:
notetab: [all your table code], dofile(name_of_your_dofile)For tables:
program define notetab, eclass
    syntax anything [using/], dofile(string) [*]

    * remove dofile option:
    local command = subinstr("`0'","dofile(`dofile')"","",.)
    local command = subinstr("`command'",":","",.)

    `command'
    file open  myfile using "'using'",  read write

    * Go to end of file
    file seek myfile eof
    file write myfile _n "% Made on `c(current_date)' at `c(current_time)' by `c(username)' in `dofile'.do"

    file close myfile
    display "~~~Added notes to  " "'using'"'
end
Here's an example:
sysuse auto, clear
eststo m1: reg price mpg
eststo m2: reg price mpg trunk

notetab: esttab * using t.tex, replace dofile(testing)
This adds a commented note to the bottom of the .tex table:
\_cons     &     11253.1\sym{***}&     11253.1\sym{***}&
       &      (9.61)        &      (9.61)        &
\hline
\(N\)     &         74         &         74         &
\hline\hline
\multicolumn{4}{l}{\footnotesize \textit{t} statistics in parentheses}
\multicolumn{4}{l}{\footnotesize \sym{*} \(p<0.05\), \sym{**}}
\end{tabular}
}

% Made on 17 Dec 2022 at 17:11:29 by JohnDoe in testing.do
For figures:
The command below does the same thing for figures. Here, an invisible note is added at the bottom of the figure:
program define notefig, eclass
    syntax anything [using/], dofile(string) [*]

    * remove dofile option:
    local command = subinstr("`0'","dofile(`dofile')"","",.)
    local command = subinstr("`command'",":","",.)

    `command' note("Made on `c(current_date)' at `c(current_time)' by `c(username)' in `dofile'.do", color(white%0))
end
Here's an example:
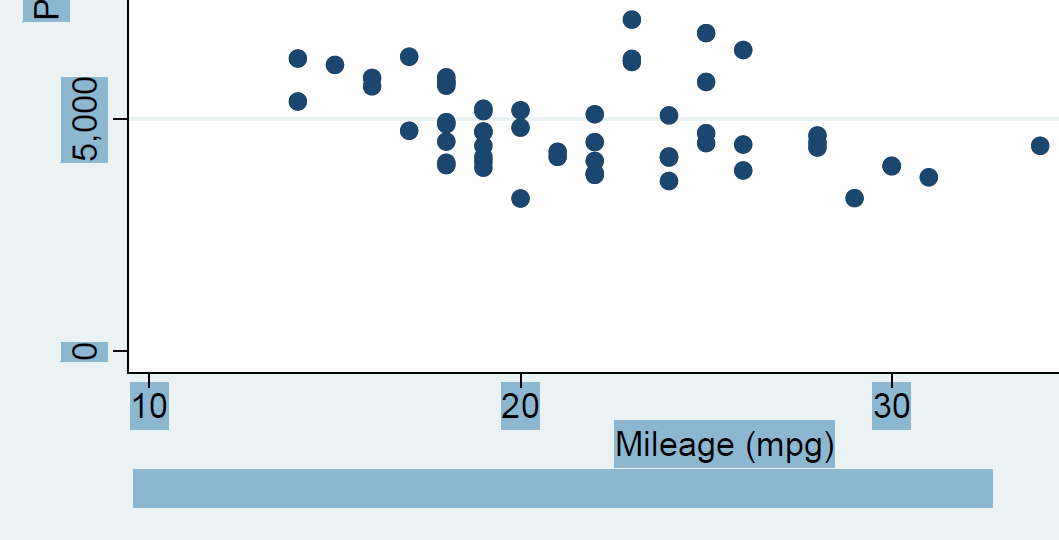
sysuse auto, clear
notefig: scatter price mpg, dofile(testing)
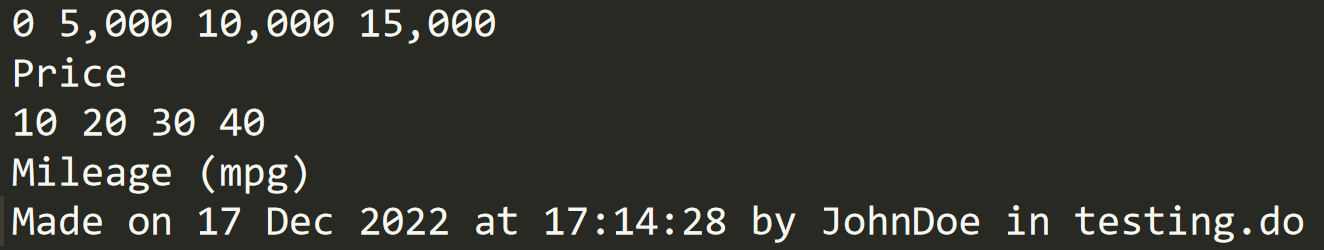
graph export t.pdf, replaceTo see the note, you can open the PDF of the figure, select all, copy, and paste into any text program.
The invisible text is at the bottom here:
And you'll see this if you copy and paste: